Why units in the same condo transact at such different PSF
Updated · written from the transacted record
Inside one Singapore condo, units near the top of the resale range typically sold for 17% more per square foot than units near the bottom, and in one project in three the gap is wider than 20%. So the project’s average PSF is a poor yardstick for the unit you want: compare units of the same size and a similar floor. That is URA’s resale record for 335 condo and apartment projects with at least 20 resales in the 24 months to 26-09-2026.
“The project transacts at about S$1,600 psf”
Every negotiation starts with a sentence like that — from the agent, the portal, or a well-meaning uncle. It compresses a building’s entire record into one number, and that one number hides a lot.
In the typical Singapore condo, units near the top of the building’s resale range sold for 17% more per square foot than units near the bottom. In one project in three (33%) the gap is wider than 20%, and in 8% it is wider than 30%.
That is the transacted record of 335 condo and apartment projects, each with at least 20 resales in the last 24 months: for each one, the gap between the 10th and 90th percentile resale PSF within the same project. The widest run far beyond the median:
| Project | p10→p90 PSF spread | Resales (24m) |
|---|---|---|
| Southaven II | +78% | 23 |
| Parc Rosewood | +73% | 75 |
| Parc Vera | +50% | 27 |
| One-North Residences | +49% | 32 |
| The Calrose | +48% | 23 |
| The Interlace | +45% | 83 |
| Meadows @ Peirce | +44% | 29 |
| People’s Park Complex | +43% | 21 |
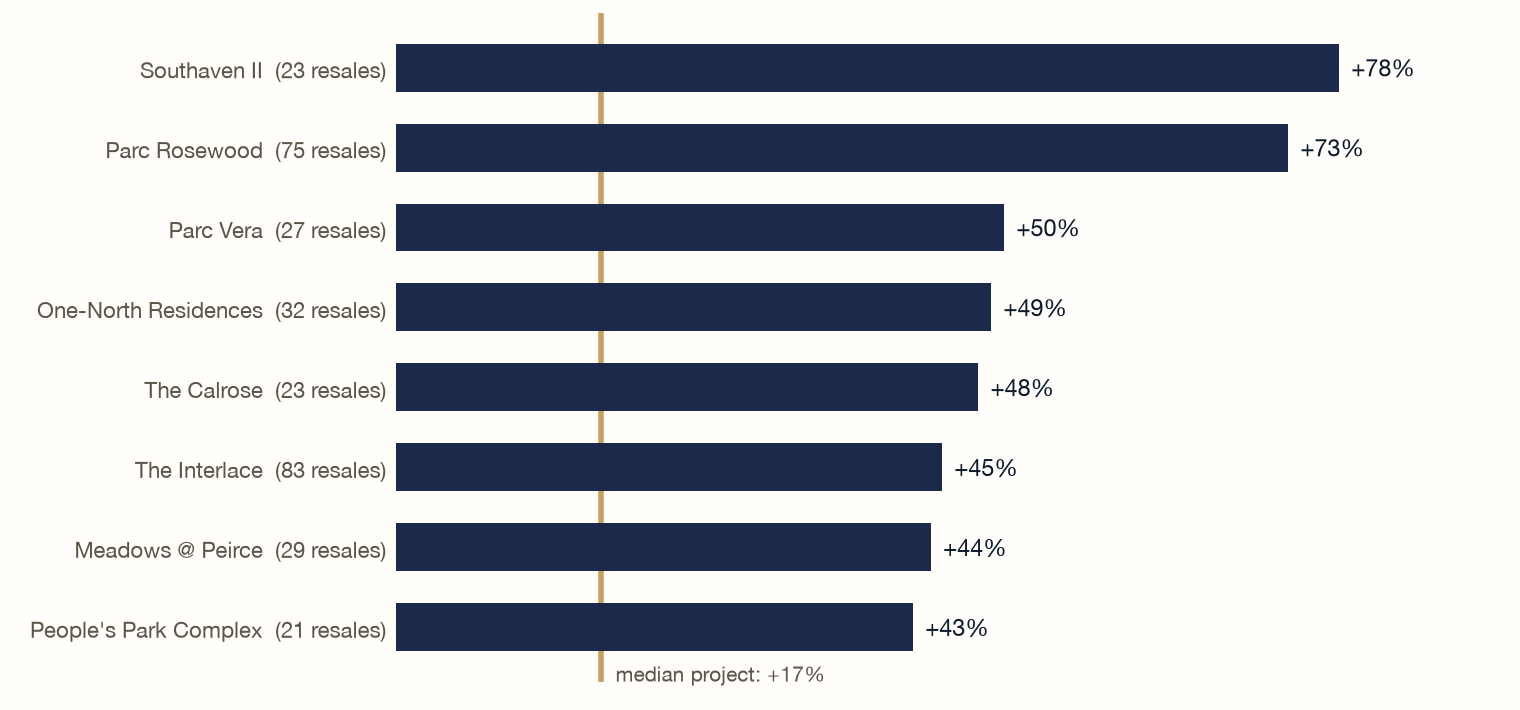
In a project that “transacts at about S$1,600 psf”, a 17% spread means its resales ran from roughly S$1,480 to S$1,730 psf. The one number told you none of it.
Where the spread comes from
Within one project, transacted PSF varies systematically with:
- Size. Smaller units transact at higher PSF almost everywhere — a project mixing one-bedders with four-bedders will show a wide spread on that alone (see our PSF guide).
- Floor. The high-floor premium is real and priced.
- Facing, stack and state — quieter stacks, unblocked views, renovation.
- When. A 24-month window includes market movement; in a rising market the early resales sit low in the range.
None of this is noise — it is structure, which is exactly why comparing your target unit to “the project average” can mislead in either direction. A high-floor two-bedder judged against an average dragged down by ground-floor four-bedders looks expensive when it is fairly priced — and vice versa.
The practical rule
Compare like with like, within the building: same size band (±15% is the tolerance we use), similar floor, recent first. Three good comparables beat thirty mixed ones. If the recent record within your size band is thin, widen carefully and say so in your negotiation — “the last comparable is 14 months old” is itself useful evidence.
This is what a PriceVero rating does mechanically: it tells you whether an asking price looks low, in line or high against comparable transacted sales — size-matched, floor-aware, recency weighted — and shows you the record it used. Name the project, pick the size and type the price at the price check. Free account: 20 ratings and 5 detailed reports on signup, then 5 ratings a month. No card required.
Check an asking price against the record. Paste a listing link, or name the project and type the price.
Free — sign in and the rating is on the screen. Want the longer form, with floor, size and the stamp duty? Open the price check. Holding a listing link instead? Paste it here. Not a valuation — a reading of a price against the evidence. Or browse condos by district and MRT.
Method
Resale caveats lodged with URA (non-landed, apartments and condominiums), 24 months to 26-09-2026. Projects with ≥20 resales (n=335). Spread = 90th percentile PSF ÷ 10th percentile PSF − 1, computed within each project. Named projects are the largest spreads among qualifying projects; counts shown. Percentile spreads are observed facts about the transacted record, not ratings of any project. Computed 26-09-2026 against records retrieved from URA on 23-09-2026.
Common questions
How much does PSF vary inside one Singapore condo?
In the typical Singapore condo, units near the top of the building’s resale range sold for 17% more per square foot than units near the bottom — the gap between the 10th and 90th percentile resale PSF, across 335 condo and apartment projects with at least 20 resales in the 24 months to 26-09-2026. In one project in three the gap is wider than 20%, and in 8% it is wider than 30%.
Why do units in the same condo sell at different PSF?
Because the price per square foot inside one project moves with the unit’s size, floor, facing, stack and renovation, and with when it sold. Smaller units transact at a higher PSF almost everywhere, and higher floors transact at a premium. None of this is noise — it is structure.
Should I compare a unit with the project’s average PSF?
Not on its own — the project average can mislead in either direction. Compare like with like, within the building: same size band (±15% is the tolerance we use), similar floor, recent first. Three good comparables beat thirty mixed ones.
Where do these figures come from?
From URA’s record of private residential resale transactions, published through URA’s data service under the Singapore Open Data Licence. The spreads are observed facts about the transacted record, not ratings of any project.
Private transaction data: contains information from URA’s Private Residential Property Transactions dataset, accessed on 23-09-2026 from the Urban Redevelopment Authority Data Service at https://eservice.ura.gov.sg/maps/api/, and made available under the Singapore Open Data Licence version 1.0 at https://data.gov.sg/open-data-licence. PriceVero has selected, arranged and analysed the source data and is solely responsible for the resulting presentation and analysis. URA does not endorse PriceVero or this analysis. Medians and shares are stated as measured, in aggregate; no individual transaction or listing is reproduced here. A PriceVero rating is not a valuation and is not prepared by a licensed valuer.